pygmt.Figure.hlines
-
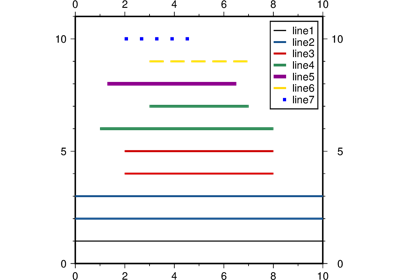
Figure.hlines(y=None, xmin=None, xmax=None, **kwargs)¶ ” Plot one or a collection of horizontal lines.
Takes a single y value or a list of individual y values and optionally lower and upper x value limits as input.
Must provide y.
If y values are given without x limits then the current map boundaries are used as lower and upper limits. If only a single set of x limits is given then all lines will have the same length, otherwise give x limits for each individual line. If only a single label is given then all lines are grouped under this label in the legend (if shown). If each line should appear as a single entry in the legend, give corresponding labels for all lines (same for pen).
- Parameters
y (float or 1d array) – The y coordinates or an array of y coordinates of the horizontal lines to plot.
projection (str) – Required if this is the first plot command. projcode[projparams/]width. Select map projection.
region (str or list) – Required if this is the first plot command. xmin/xmax/ymin/ymax[+r][+uunit]. Specify the region of interest.
frame (bool or str or list) – Set map boundary frame and axes attributes.
cmap (str) – File name of a CPT file or a series of comma-separated colors (e.g., color1,color2,color3) to build a linear continuous CPT from those colors automatically.
offset (str) –
dx/dy. Offset the line locations by the given amounts dx/dy [Default is no offset]. If dy is not given it is set equal to dx.no_clip (bool or str) –
'[c|r]'. Do NOT clip lines that fall outside map border [Default plots lines whose coordinates are strictly inside the map border only]. The option does not apply to lines which are always clipped to the map region. For periodic (360-longitude) maps we must plot all lines twice in case they are clipped by the repeating boundary.no_clip=Truewill turn off clipping and not plot repeating lines. Useno_clip="r"to turn off clipping but retain the plotting of such repeating lines, or useno_clip="c"to retain clipping but turn off plotting of repeating lines.pen (str) – Set pen attributes for lines or the outline of symbols.
Select verbosity level [Default is w], which modulates the messages written to stderr. Choose among 7 levels of verbosity:
q - Quiet, not even fatal error messages are produced
e - Error messages only
w - Warnings [Default]
t - Timings (report runtimes for time-intensive algorthms);
i - Informational messages (same as
verbose=True)c - Compatibility warnings
d - Debugging messages
xshift (str) – [a|c|f|r][xshift]. Shift plot origin in x-direction.
yshift (str) – [a|c|f|r][yshift]. Shift plot origin in y-direction. Full documentation is at https://docs.generic-mapping-tools.org/latest/gmt.html#xy-full.
zvalue (str or float) –
value. Instead of specifying a line color via pen, give it a value via zvalue and a color lookup table via cmap. Requires appending +z to pen (e.g.pen = "5p,+z",zvalue = 0.8,cmap = "viridis").label (str) – Add a legend entry for the line being plotted.
perspective (list or str) – [x|y|z]azim[/elev[/zlevel]][+wlon0/lat0[/z0]][+vx0/y0]. Select perspective view and set the azimuth and elevation angle of the viewpoint. Default is [180, 90]. Full documentation is at https://docs.generic-mapping-tools.org/latest/gmt.html#perspective-full.
transparency (int or float) – Set transparency level, in [0-100] percent range. Default is 0, i.e., opaque. Only visible when PDF or raster format output is selected. Only the PNG format selection adds a transparency layer in the image (for further processing). transparency can also be a 1d array to set varying transparency for lines.